Skip to content
OnSite Solutions
BENEFITSWHAT’S INSIDE
WHO IT IS FORTHREE CUSTOMER GROUPS
PROBLEMDATA IN SILOS
TODAY
PHASE 1UNDERSTAND
PHASE 2DECIDE
PHASE 3DESIGN
PHASE 4OPERATE
TRY ITYOUR BUILDING
PORTFOLIOTHE WHOLE PORTFOLIO
RETHINKING BUILDING DIGITALISATION

Your building can do more than it shows today.

Less energy, less CO₂, and a clear path to get there.

We measure what a building can do today, quantify what is possible, and guide it step by step into connected operation. For owners, planners and manufacturers. Step inside.

BAIOSS free trial
SCROLL TO ENTER
STEP INTO THE FUTURE
0013AF5010BF50013A101F010001
Welcome to
OnSite Solutions
Ding
Dong
ROOM 2.14
EXAMPLE: OFFICE, 1998, 5,200 m²
PV systemLEDReplace ventilationInsulate roofWindowsUpgrade BMSHeat pumpCharging pointsSun protection
5 FLOORS36 M
?
?
?
?
?
NEED: DEMAND-CONTROLLED VENTILATION, 2030, €48KPV LOAD MANAGEMENT, 2029CONNECT COOLING, 2031
CONNECTED
BEHIND THE DOOR

An ordinary office building. Built in 1998, 5,200 m². Everything works.An example building.

An example building. This is its potential once it runs connected and on demand:This is what it holds when it runs connected and on demand.

Built 19985,200 m²9 systems
−0%
Energy costs per year
around €38k less, with the same comfort
SRI 14 % → 58 %AUTOMATION CLASS D → B (DIN EN ISO 52120-1)REQUIREMENTS FROM EPBD AND GMODG MET THESE ARE EXAMPLE FIGURES. YOUR FIGURES COME FROM YOUR ASSESSMENT.
−0t CO₂
CO₂ per year
avoided, because systems only run when they are needed
0,0years
Payback
for around €160k invested in nine systems
TODAYOWNERS, ASSET MANAGERS, INVESTORS

The portfolio needs to be future-proof. But where do you start?

A hundred measures, twenty vendors, each recommending their own solution. On top of that, new obligations from EPBD and GModG, ESG reports that demand reliable figures, and systems whose data sits with the manufacturer rather than with you.A hundred measures, twenty suppliers. Plus new obligations from the EPBD and GModG, ESG reports with reliable figures, and data that sits with the manufacturer.

Too many optionsRegulatory pressureData sits with the manufacturerSkills shortage in operations
WITH BAIOSS

Hard numbers instead of gut feeling.

An assessment shows where each building stands. It produces a list of measures with costs, savings, CO₂ impact and return, sorted by your goals. You decide what comes first and see in advance what it delivers. BAIOSS ranks measures by your goals, not by vendors. You decide who gets to see your enquiry.An assessment shows where each building stands. From it comes a list of measures with costs, savings, CO₂ and return, sorted by your goals, not by suppliers.

RESULT1 dayon site. After that you know where your building stands and what to do first.
TODAYPLANNERS AND ENGINEERING FIRMS

In service phases 1 to 3 (HOAI), nobody knows yet which data the building will need later.Which data will the building need later?

Requirements for data points and structures stay vague, every trade delivers its own format, and in operation nothing fits together. There is no translator between client, operator and manufacturer.Requirements for data points stay vague, every trade delivers its own format, nothing fits together in operation. The translator is missing.

Requirements not definedCommunication gapData structure defined too late
WITH BAIOSS

Your tool for a new service offering.

Offer assessments, SRI ratings, lists of measures and target paths as your own consulting service. Define data structures from service phase 1 and maintain them through to operation. You become the link between the property side and the technical side.Assessments, SRI rating, lists of measures and target paths as your own consulting service. Define data structures from design stage 1 and keep them into operation.

RESULTfrom service phase 1the data structure is fixed before the first data point is installed.
TODAYMANUFACTURERS, SYSTEM PROVIDERS, CONTRACTORS

Your solution is good. The demand arises elsewhere.

Owners do not know they need your solution, planners have not heard of it, and by the time an enquiry arrives the right moment has often passed. Leads come by chance.Owners do not know their need, planners do not know your solution, and the enquiry often comes too late. Leads arise by chance.

Invisible demandWrong timingRandom leads
WITH BAIOSS

Demand meets solution.

Every strategy names specific measures and, for each one, matching solutions from our database. Where your product fits a measure, it is shown to the owner as an option. Once the owner releases the enquiry, you receive the building, budget, target year and contact person.Matching solutions from our database for every measure. Once the owner releases the enquiry, you receive building, budget, target year and contact.

RESULT3 of 12buildings in the example portfolio need demand-controlled ventilation by 2030. Three enquiries that find their way to you.
PLUSIT consulting and project delivery, when it takes more than a tool: data models, interfaces, AI agents.
THE REAL PROBLEM

The data is there. The systems just do not talk to each other.

Heating, ventilation, room sensors, CAFM: every system collects data, each in its own silo. That makes analysis across the whole building impossible. And the people who know the systems will retire in the coming years.Heating, ventilation, room sensors, CAFM: each system collects data for itself. There is no picture of the whole building. And those who know the systems will retire soon.

EXAMPLE

The CO₂ level in room 2.14 stays flat all day. So nobody was there. So there is no need to clean tonight. A simple conclusion from three systems. Impossible today, because the data is kept apart.The CO₂ level in room 2.14 stays flat: nobody there, no cleaning today. A simple conclusion from three systems. Impossible today, because the data is kept apart.

WHAT BECOMES POSSIBLE

Whoever brings their data together can rethink processes.

One shared data model, with an AI that prepares decisions and agents on top, including third-party ones. We show how it works in four phases, using this one building.A shared data model, on it an AI that prepares decisions, and agents, also from third parties. Four phases show how it works, on this one building.

KEEP SCROLLING OR CLICK TO CONNECT THE BUILDING
VENTILATION
410 ppm CO₂
flat since 08:00, supply air runs on schedule
✕NO CONNECTION
ROOM SENSOR
Room 2.14: 22.1 °C
stable, sensor reports only to the room controller
✕NO CONNECTION
HEATING
21.0 °C setpoint
since 06:00, without feedback from the room
✕NO CONNECTION
CAFM
Room 2.14: cleaning
today 18:00, scheduled like every day
SHARED DATA MODELHOW IT COULD BE
Room 2.14: nobody there todayCleaning: cancelledVentilation, heating: economy mode
?
1
1
1
1
1
1
1
1
Roof: own controller
Rooms: light switches
Facade: manual operation
Basement: own building management
Cloud
BAIOSS DATA MODEL
Energy
Maintenance
Comfort
Your process
DATA STREAM
ASSESSMENT: LEVEL OF AUTOMATION PER SYSTEM
Assessment starts
From the roof to the basement, system by system.
manualoperated by hand, no automation
partlysome functions automated, not connected
automateddemand-controlled and connected
Ventilation
Cooling
Electricity
Lighting
Dynamic building envelope
EV charging
Monitoring and control
Domestic hot water
Heating
RESULT: THREE INDICATORS FROM ONE ASSESSMENT
%
SRI
Smart Readiness Indicator
EU directive EPBD
D
A TO D
Degree of building auto­mation
DIN/TS 18599-11
CLASS D
D
A TO D
Automation class
DIN EN ISO 52120-1
CLASS D
WEIGHT THE GOALSEXAMPLE, TRY THE SLIDERS
CO₂50 %
Cost50 %
Return50 %
Digitalisation50 %
MEASURES BY PRIORITYIMPACT, COST
BAIOSSLegal requirementsRenovation roadmapOther
1
Occupancy-controlled lighting
BAIOSS Assessment
+5 SRI, 6 t CO₂, €12k, ROI 3 years
1
Open BMS interfaceMANDATORY
Legal obligation, § 56 GModG
+8 SRI, 4 t CO₂, €35k, ROI 9 years
1
Demand-controlled ventilation
BAIOSS Assessment
+6 SRI, 14 t CO₂, €48k, ROI 6 years
1
Heating curve, schedules
Other: fault messages from the BMS
+6 SRI, 9 t CO₂, €6k, ROI 1 year
1
Connect cooling
BAIOSS Assessment
+4 SRI, 5 t CO₂, €44k, ROI 8 years
1
Replace windowsSTRUCTURAL
Individual renovation roadmap
22 t CO₂, €180k, ROI 14 years
1
PV load management
BAIOSS Assessment
+4 SRI, 8 t CO₂, €20k, ROI 4 years
1
Insulate roofSTRUCTURAL
Individual renovation roadmap
16 t CO₂, €120k, ROI 12 years
6 OF 8 MEASURES IN THE PACKAGE
TARGET PATHEXAMPLE: SRI 50 % BY 2032
A target for one indicator, to be reached by a set year
Target 50 % Target path 2026202820302032 14 % on track well below targetVentilation first, cooling later back on track Target reached 123456
12027Heating curve, schedules
22027Occupancy-controlled lighting
32029Open BMS interface
42030Demand-controlled ventilation
52031Connect cooling
62032Replace windows
WE CHECK IN REGULARLY, COMPARE WITH THE TARGET AND RE-PRIORITISE
TODAY: DATA CHAOS1 OF 3
Building
Building
Rooms
Heating
Ventilation
Floor 2
Airflow sensor
Room 2.14
Occupancy sensor
NINE SYSTEMS, NINE LANGUAGES, NO COMMON PICTURE
AGENTS ON BAIOSS
Data stream active: Values from nine systems flow into the model and back.
Energy
optimises system operation, continuously
Maintenance
detects faults before anyone notices
ComfortThird party
controls indoor climate by occupancy
Your own process, rethought
for example billing tenant electricity, set up by you as an agent
+Create a new agent
Only the shared data model makes these data streams possible. BAIOSS provides it; the agents build on it.
EVERY AGENT CAN BE SWITCHED ON AND OFF INDIVIDUALLY. RETHINK YOUR OWN PROCESSES AND SET THEM UP AS AGENTS
TRY IT ON YOUR BUILDINGLIVE
%Class
Target 50 % 20262032 target path
k€
PORTFOLIO OVER TIME
One building is the beginning. The portfolio is the goal.

The same indicators, the same prioritisation for every building. Measures are bundled into packages and rolled out across the whole portfolio in waves, all buildings connected through one data model.The same key figures and the same prioritisation for every building. Measures are bundled into packages and rolled out in waves across the portfolio.

Target 2045: SRI 90 %, climate-neutral20262045Portfolio 35 %90 %Wave 1Wave 2Wave 3
Portfolio averageYour buildingother buildings
Wave 1Office complexes 1 and 2Heating curve, lighting
Wave 2Office complexes 3 to 8Interfaces, ventilation
Wave 3Office complexes 9 and 10PV, agents

How it works

Connected. Where do you start? With what is already there.

Four phases, one data model, on this one building. First, find out where it stands today: system by system, measurable and comparable.

We survey every system.

One day on site or automatically from existing data. The assessment checks the level of automation for every system: operated by hand, partly automated or connected and demand-controlled.One day on site or automatically from existing data. For each system: operated by hand, partly automatic or controlled on demand.

Three indicators show where a building stands.

The Smart Readiness Indicator from the EU directive EPBD rates from 0 to 100 % how well the technology of a building can do three things: be operated efficiently, respond to the people in the building and adapt to the power grid. In addition, there are the degree of building automation under DIN/TS 18599‑11 and the automation class under DIN EN ISO 52120‑1, each rated A to D. All from a single assessment.The SRI from the EU directive EPBD rates from 0 to 100 % how smart the technology is. Plus building automation level and automation class, each A to D.

Many measures, many sources. What comes first?

Every measure has a cost, a saving, a return and a CO₂ effect. But it competes with others, some reinforce each other, some rule each other out. BAIOSS brings all sources together and ranks them by the goals you have weighted. If the goals shift, the order shifts with them.Every measure has costs, savings, a return and a CO₂ effect. BAIOSS orders them all by your goals. If the goals shift, the order shifts.

Set a target. Stay on track. Re-prioritise.

A target value is set for one indicator by a set year. We stay with you along the way, compare progress with the target path and reorder the measures when the building goes off course. Every point below the path is a measure that has been implemented.A target value by a target year. We compare continuously with the target path and reorder the measures when the building drifts off course.

Today: data chaos. Nothing talks to anything else.

The technical systems on the roof and in the basement have their own controllers, the sun protection is operated by hand, the lighting by switches, the charging point reports to the manufacturer’s cloud. Analyses across the whole building are not possible this way.Systems on the roof and in the basement have their own controls, blinds and lighting run by hand, the charging point reports to the cloud. No picture of the whole building.

Sort, connect, network. The building at the centre.

BAIOSS assigns every system to its equipment and its room and connects everything into a semantic data structure with the building at the centre. Independent of the manufacturer and directly usable by every planner and every trade.BAIOSS assigns every system to its plant and its room, in one data structure with the building at the centre. Vendor-neutral, usable by every trade.

Now the data flows. Agents put it to work.

Data streams from every system into the model, agents analyse it and send commands back: energy, maintenance, comfort. This only becomes possible through the shared data model of BAIOSS. Every agent can be switched on and off individually, including those from third parties. You can rethink your own processes and set them up as agents yourself.Data from every system flows into the model, agents evaluate it and control back: energy, maintenance, comfort. Each agent can be switched on and off individually.

Now it’s your turn.

All systems with a plus sign are clickable, in the building or in the list on the right. Every click moves up one level: manual, partly, automated. The display above the building shows whether the target is reached.Tap a system in the building. Each tap moves it up one level. The display shows whether the target is reached.


BENEFITS

What changes in the building.

Digitalisation is not an end in itself. It cuts costs, fulfils obligations, makes buildings more pleasant and portfolios manageable. The same data, four effects.

ENERGY AND COSTS

Less energy, more value.

A connected, automated building uses significantly less heating energy and electricity. The investment pays off within a few years, and the building remains lettable and financeable.

Heating energy today100 %
digitalised> 60 % less
Electricity today100 %
digitalised> 16 % less
> 60 %
savings potential for heating energy through digitalisation
< 10–20 %
of the cost of conventional renovation, relative to the energy saved
< 3–4 years
payback, usually achievable with digitalisation measures
OPERATION AND MAINTENANCE

Better straight away, with no investment.

Simply fine-tuning existing technology improves smart readiness. Agents detect faults early, maintenance becomes predictable, quotes become comparable.

3 indicators
for building and portfolio
1 day
on site for the assessment
0 detours
open interfaces instead of various manufacturers’ clouds
COMFORT

Comfort where people are.

Light, air and temperature follow occupancy, not the schedule. Rooms are comfortable when in use and save energy when empty.

Lighting and ventilation only when occupied
9 domains
from heating to EV charging
3 levels
manual, partly, automated
54 services
rated in the assessment
OBLIGATIONS

Less electricity, less CO₂, obligation met.

The building automation obligation under § 56 GModG becomes part of the list of measures instead of a surprise. Every building in the portfolio gets a path towards climate neutrality.

CO₂ per building
> 16 %
savings potential for electrical energy consumption through digitalisation
> 70 kW
§ 56 GModG applies from this rated output
2045
portfolio path to climate neutrality

Four phases, one data model.

With BAIOSS from today’s state to automated operation, on one shared data foundation, from a single building to the whole portfolio.

1

Understand

Assess the current state

All systems surveyed, three indicators per building, in one day on site or automatically from existing data.

RESULT
SRI, degree of building automation and automation class, with a report.

2

Decide

Prioritise and plan

Measures from all sources ranked, including structural ones. Target set, reviewed regularly and re-prioritised.

RESULT
List of measures ranked by your goals, with costs, impact and target path.

3

Design

The basis for all trades

Isolated systems become one shared data model used by planners, installers and operators, independent of any manufacturer.

RESULT
Data model of the building as the specification for planning and tendering.

4

Operate

Agents at work

Energy, maintenance, comfort, your own processes. Full control over data and access.

RESULT
Agents in ongoing operation, data and access in your hands.

NEWS

Blog and events

Stone chess pieces with windows like buildings, an office building in the background (illustration)5–7 Oct
EVENT · MUNICH29/09/2026

EXPO REAL 2026: meet us in Munich

From 5 to 7 October we are visiting EXPO REAL. We have no stand of our own, but we are on site on all three days.

Read more →
Tower Bridge in London on a sunny day, the Thames in the foreground14 Oct
TALK · LONDON29/09/2026

Smart Buildings Show London: Tristan Emich speaks about the SRI in practice

On 14 October our CEO Dr.-Ing. Tristan Emich gives the talk “From Smart Readiness to Smart Decisions” at ExCeL London.

Read more →
Brandenburg Gate in Berlin in the morning light, the television tower on the left21–23 Oct
EVENT · BERLIN29/09/2026

Wildcard for Stage Two: we pitch in the final in Berlin

A wildcard from Better Ventures has qualified us for Stage Two 2026, the largest European competition for university startups.

Read more →
28 Oct
EVENT · MAINZ29/09/2026

BACtwin 2026: we are taking part in Mainz

On 28 October we take part in the forum on the digitalisation of technical building management at Mainz University of Applied Sciences.

Read more →
Skyline of Frankfurt am Main with the bank towers, the old town with Römer and Paulskirche in front4–5 Nov
EVENT · FRANKFURT29/09/2026

EnOcean Alliance Summit 2026: ambient IoT in Frankfurt

In early November the ecosystem around battery-free wireless sensors meets in Frankfurt. We will be there on both days.

Read more →
Logo of the GROUNDBREAKERS Summit, black lettering on a mint green background5 Nov
EVENT · STUTTGART29/09/2026

GROUNDBREAKERS Summit 2026: green ideas for the construction industry in Stuttgart

On 5 November startups, companies from the construction and building sector and research meet at Halle 93. We will be there.

Read more →
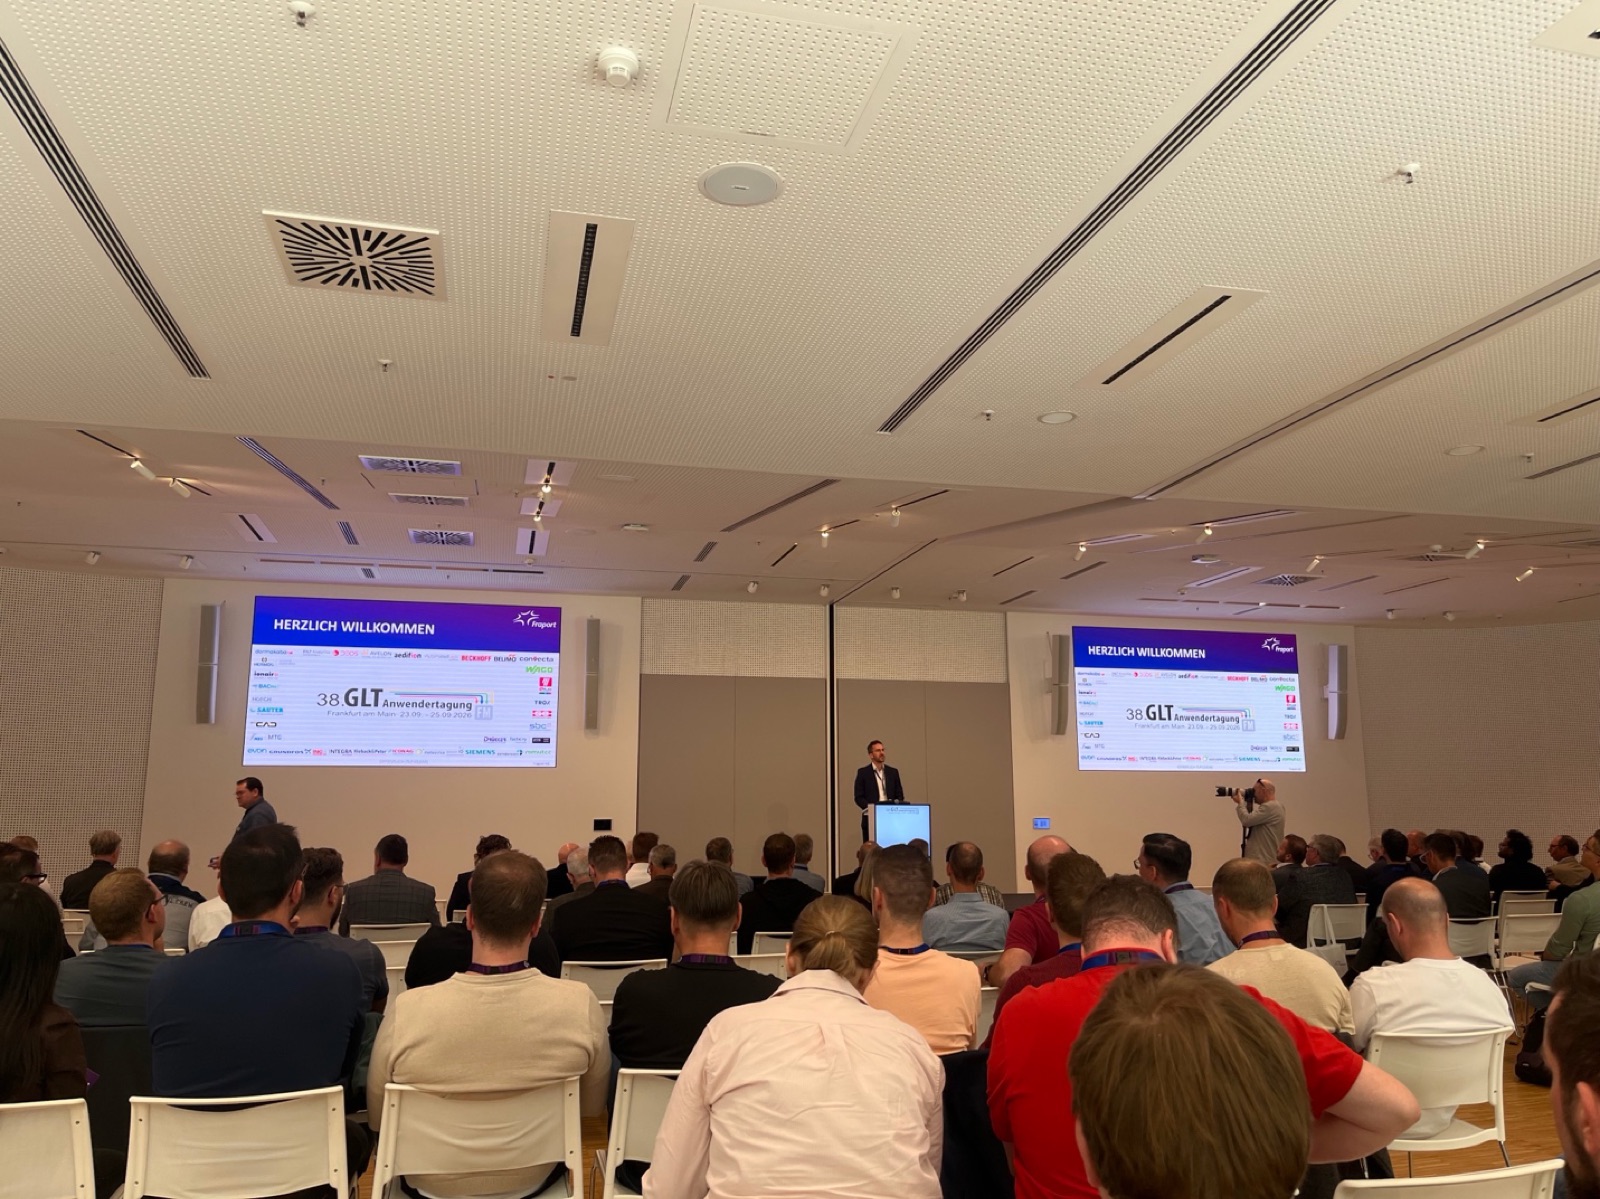
Welcome address at the 38th GLT user conference, view across the audience to the stageReview
REVIEW · FRANKFURT25/09/2026

38th GLT user conference: a great success at Frankfurt Airport

Three days of building automation and technical building management at HOLM. The need to evaluate building management system data in a structured way is great.

Read more →
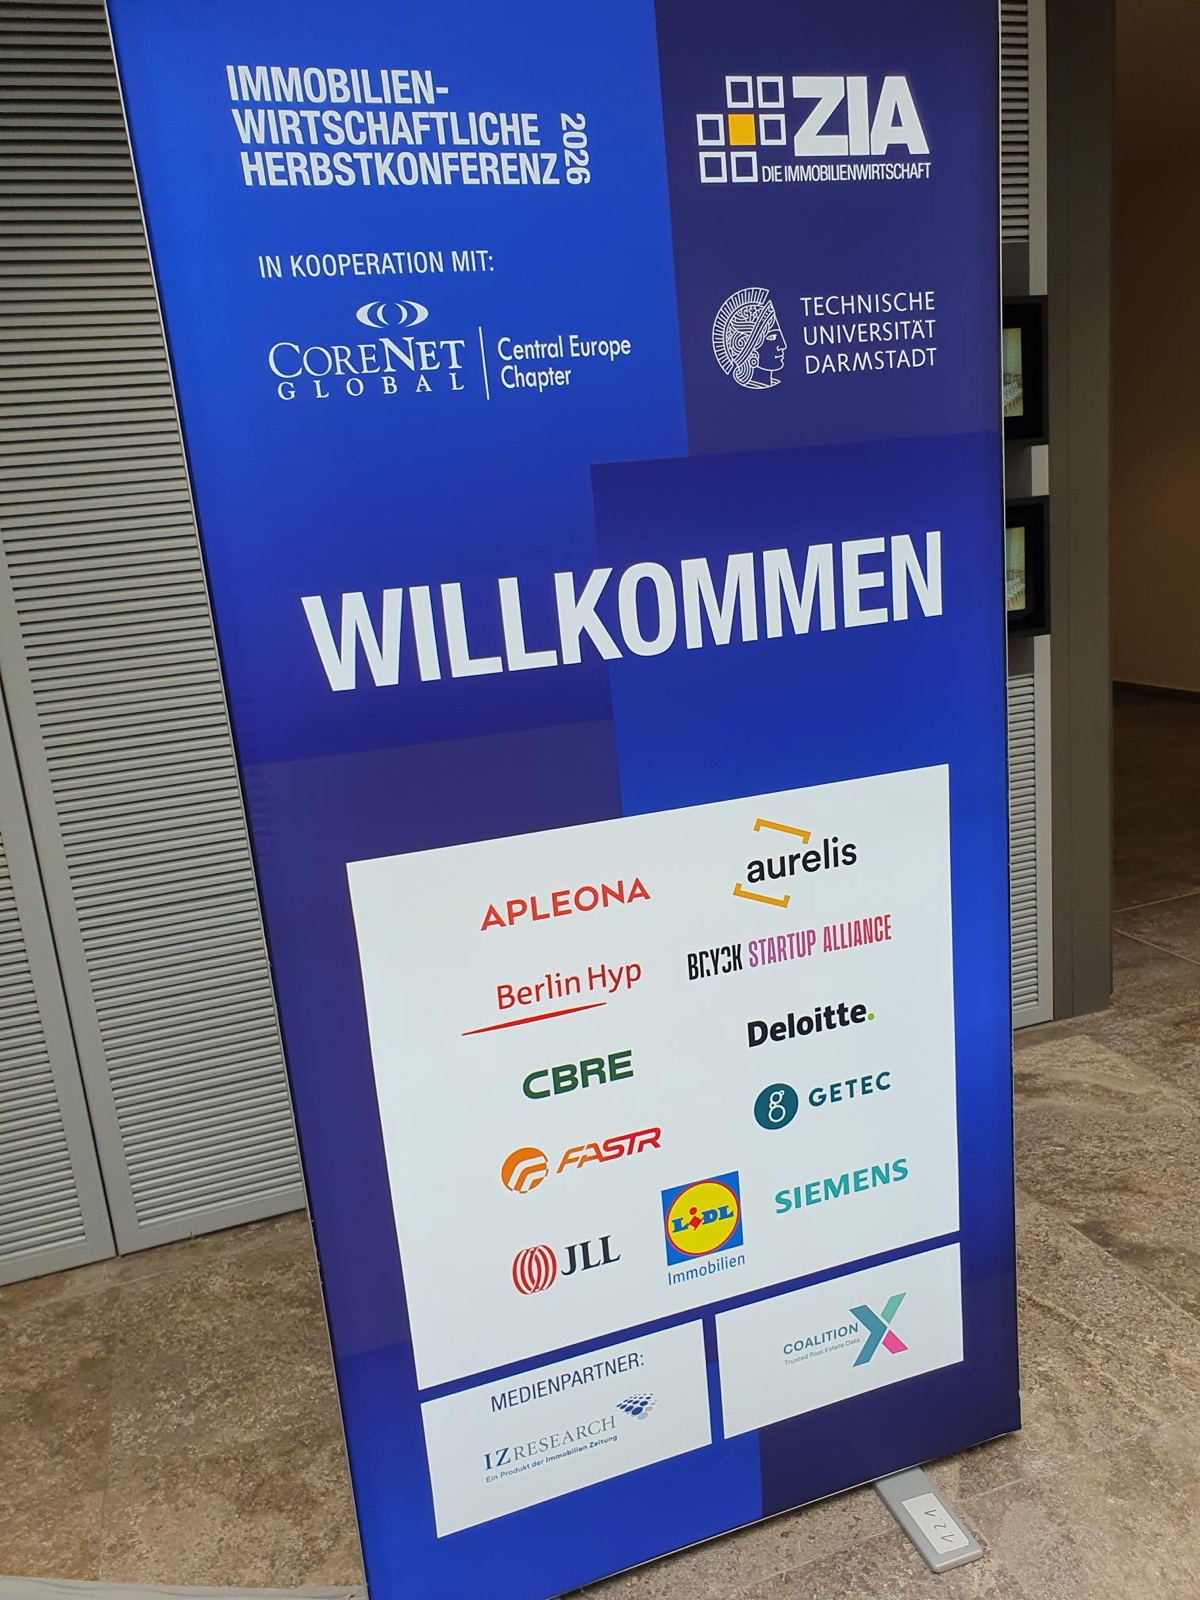
Banner at the entrance of the ZIA autumn conference 2026 with the word “Willkommen” and the logos of the partnersReview
REVIEW · BERLIN24/09/2026

ZIA autumn conference 2026: corporate real estate in transition

How can companies use their property to stay competitive and decarbonise their building stock at the same time? Our review of the ZIA autumn conference in Berlin.

Read more →
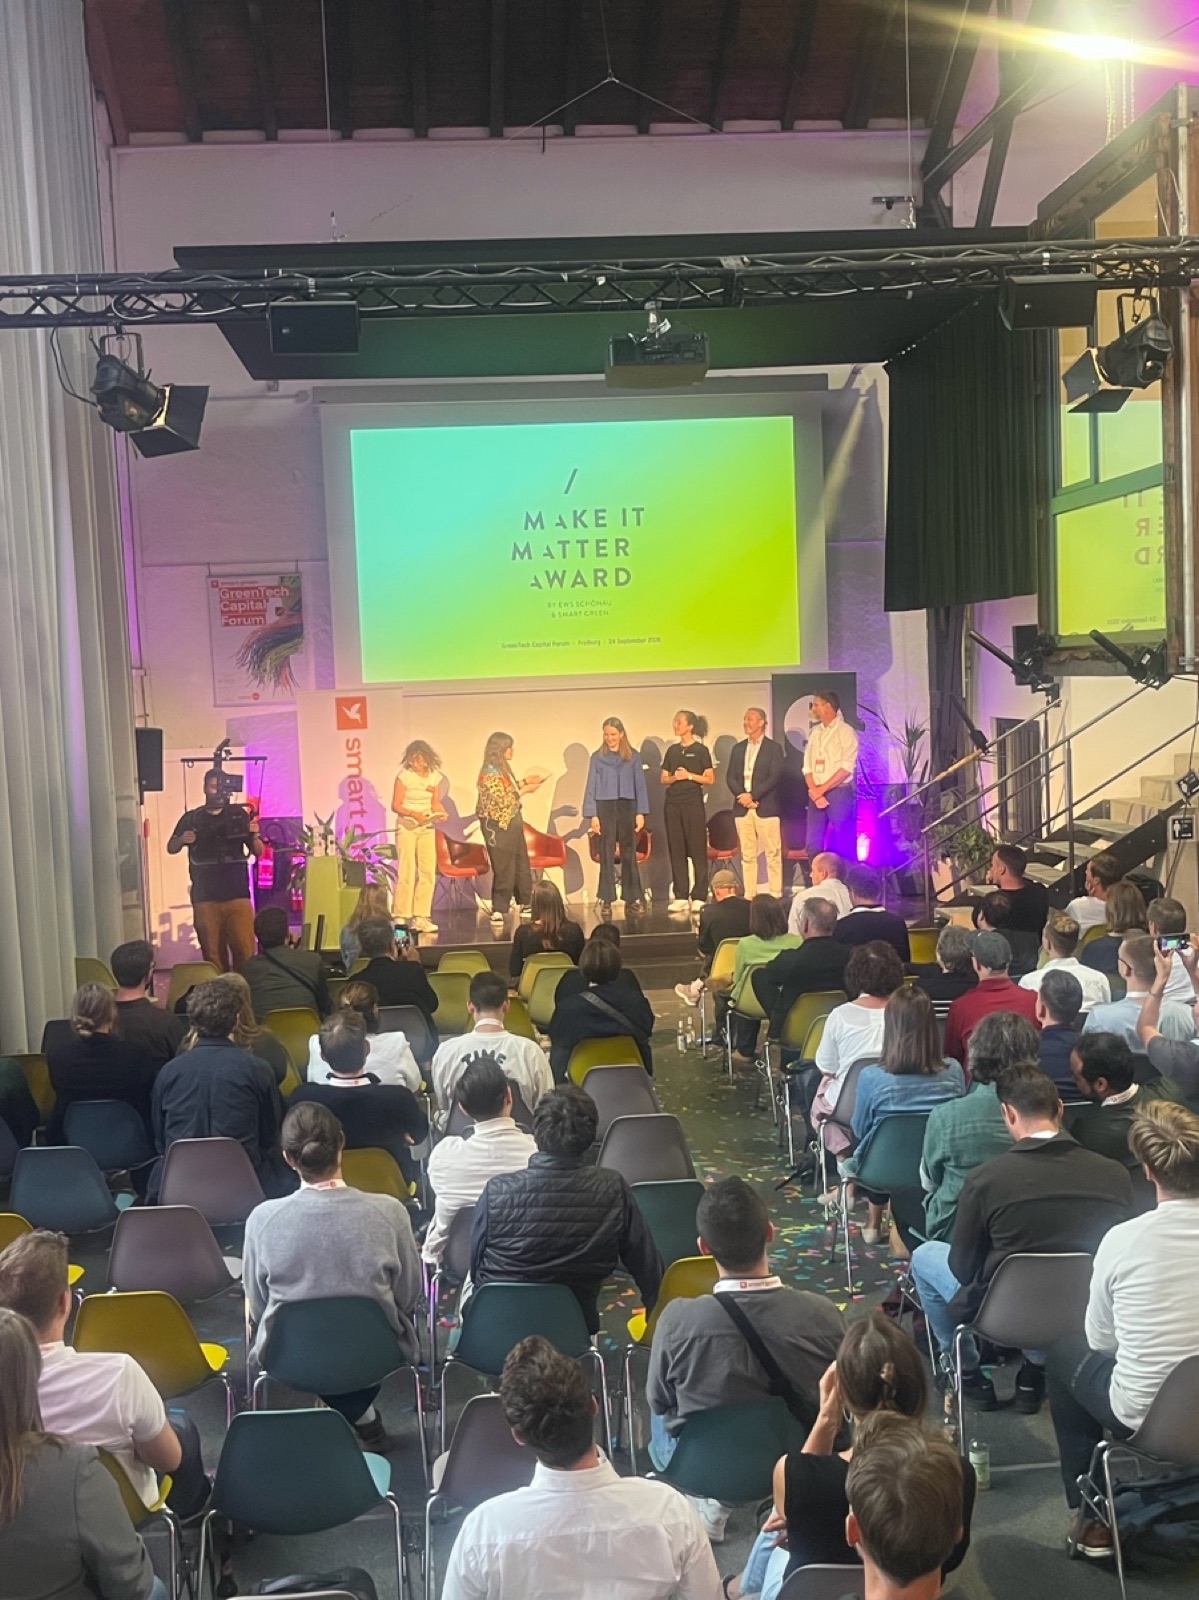
MakeItMatter award ceremony on stage, with the audience in frontReview
REVIEW · FREIBURG24/09/2026

GreenTech Capital Forum 2026: a day of investor meetings in Freiburg

Around 100 teams, 50 investors and pre-matched one-to-one meetings: our review of the GreenTech Capital Forum in Freiburg.

Read more →
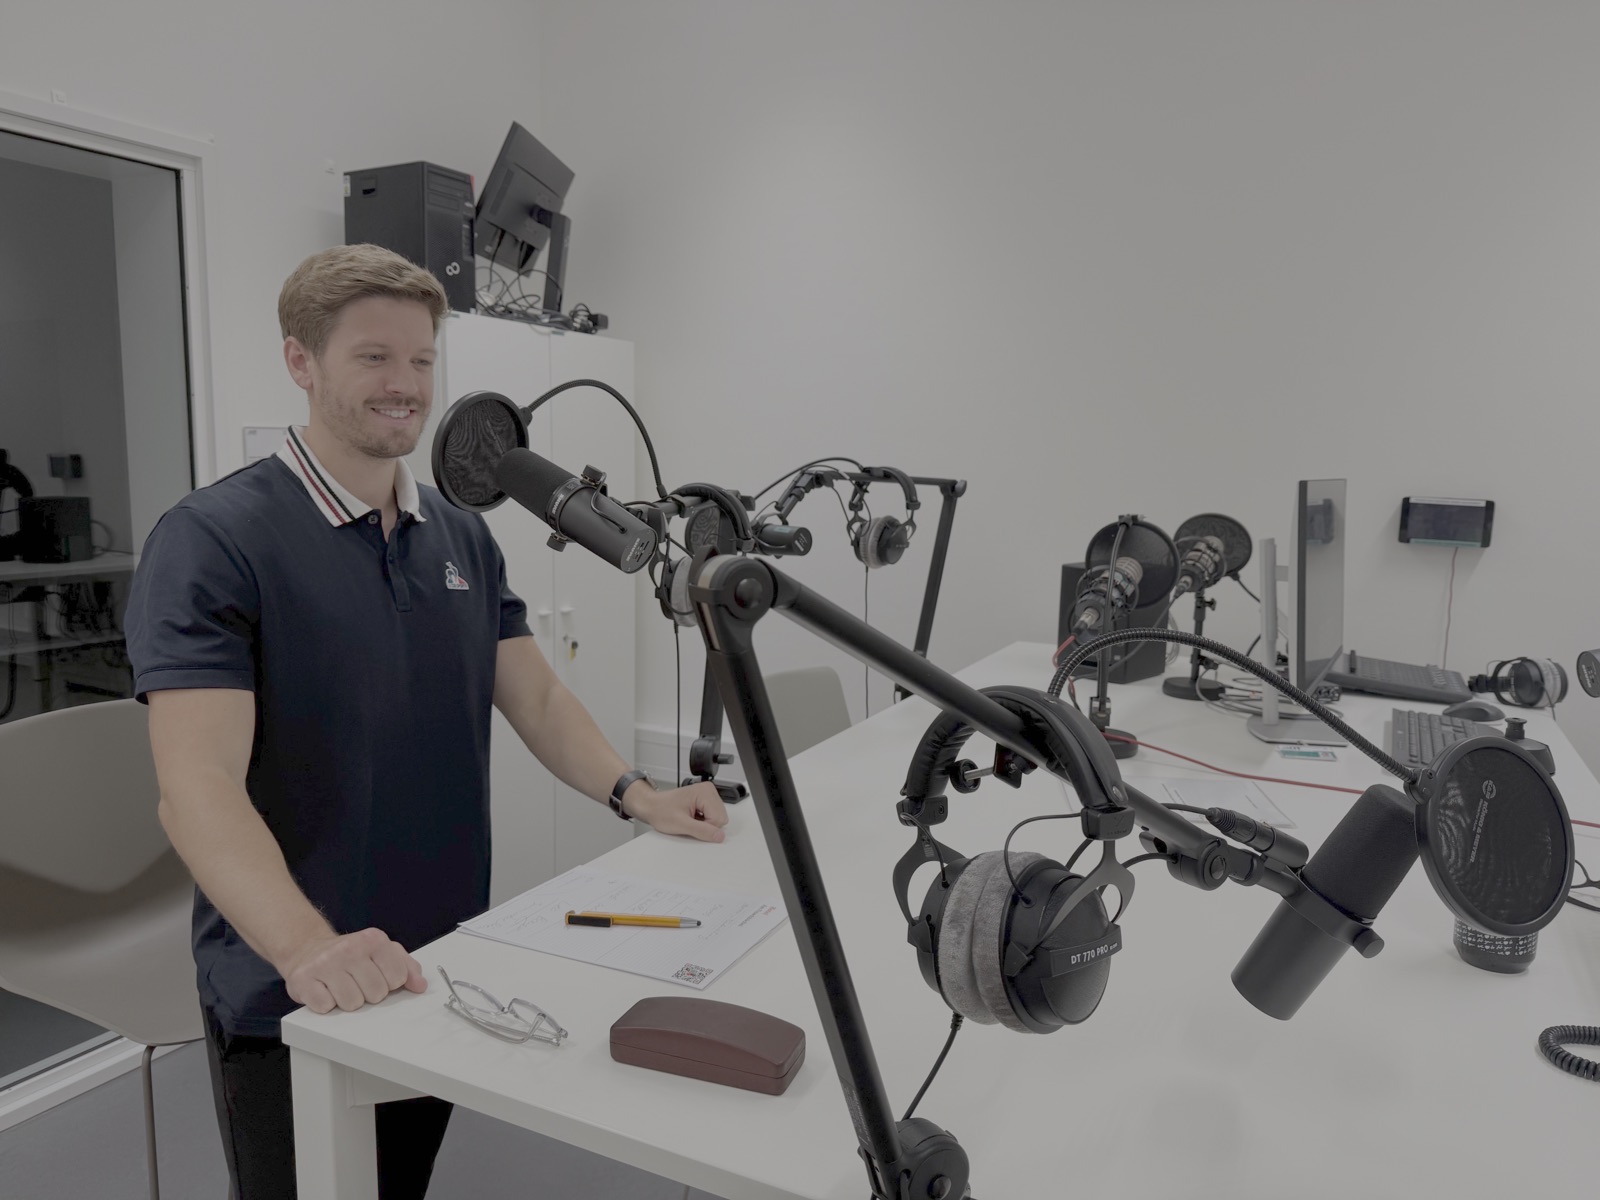
Recording in the podcast studio with microphones and headphones on the tablePodcast
BLOG PODCAST22/09/2026

Listen now: we are “startup of the month” at TOMORROW'S FOUNDERS

Our co-founder Dr. Tobias Kropp talks in the startup podcast about how buildings finally become truly digital.

Read more →
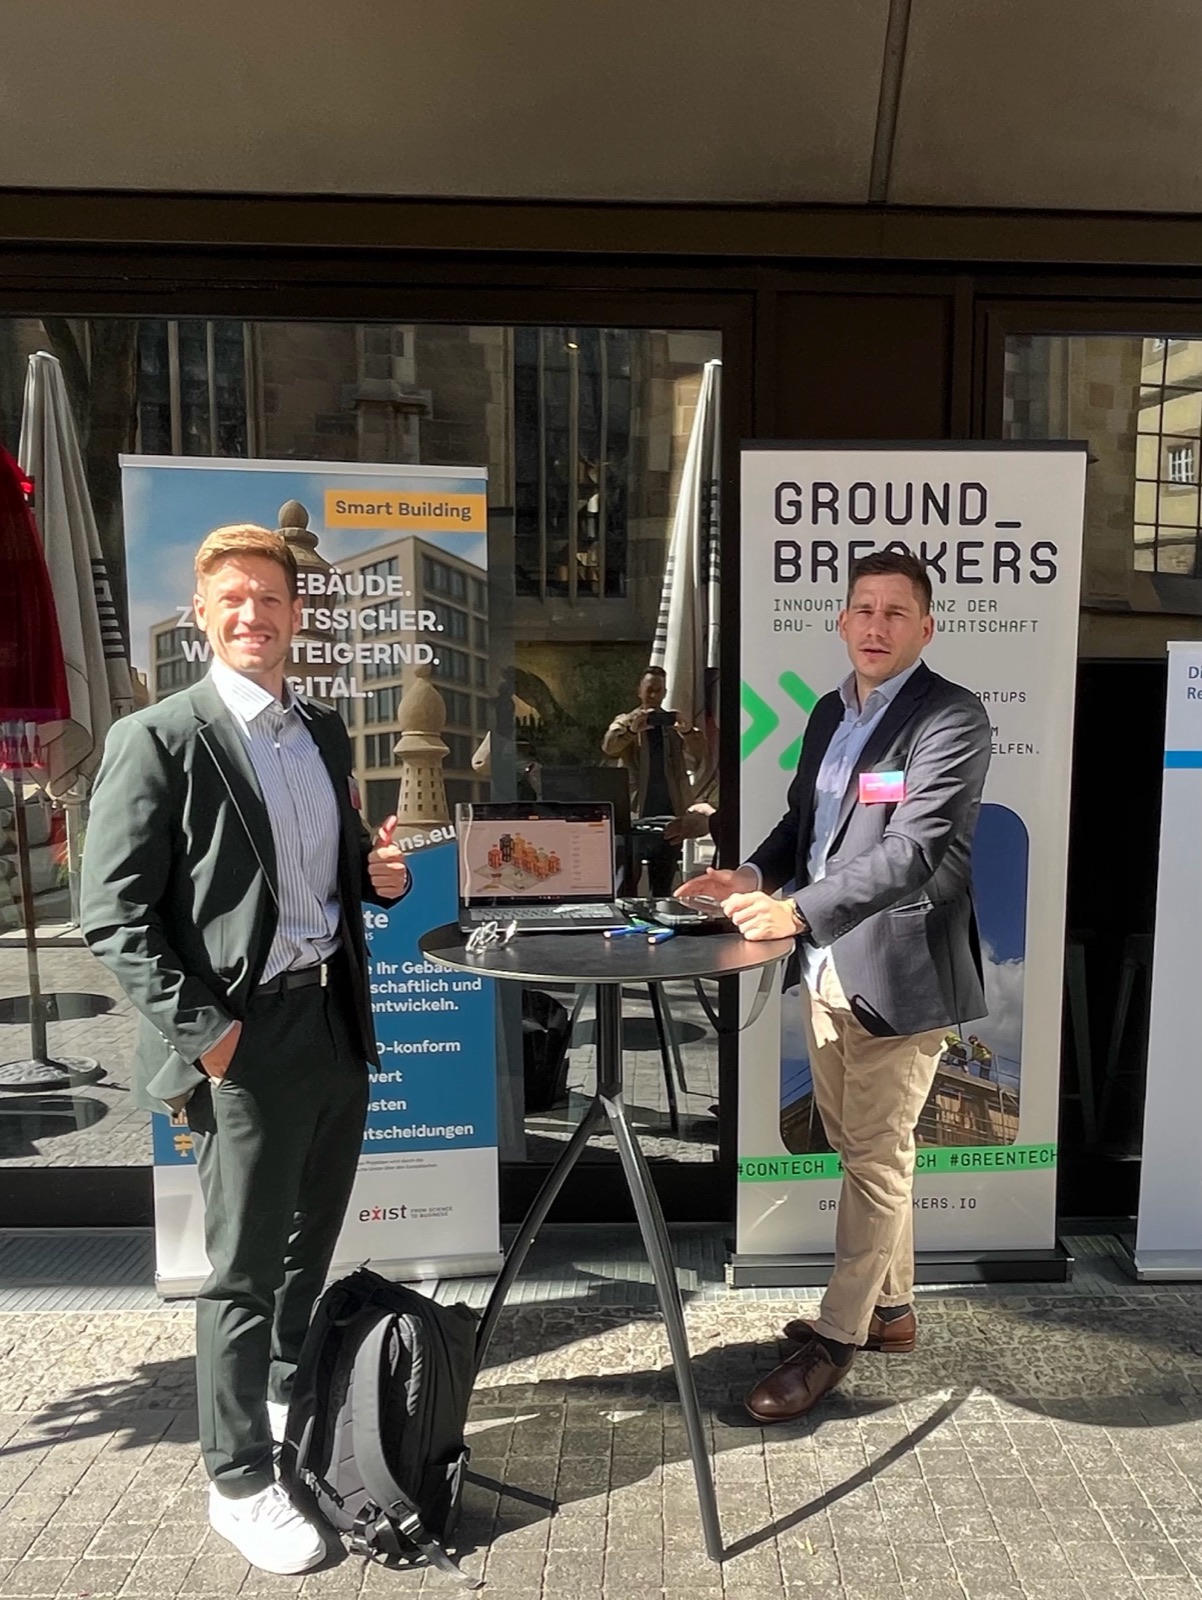
Our stand at Symposium Zukunft Bauen, two people at a bar table in front of the banners of OnSite Solutions and GROUNDBREAKERSReview
REVIEW · STUTTGART22/09/2026

Symposium Zukunft Bauen: the EU buildings directive in practice

The EPBD in non-residential buildings: what the German building modernisation act means for companies and municipalities with their own building stock.

Read more →
ABOUT US

From research. For existing buildings.

OnSite Solutions was founded in Karlsruhe and brings scientific findings from KIT directly into real estate practice. BAIOSS emerged from the German test phase for the Smart Readiness Indicator and is developed in Karlsruhe, by people who help write the standard.

Dr.-Ing. Tristan Emich
FOUNDER AND CEO

Civil engineer with a doctorate from KIT’s Chair of Facility Management. Research focus on the Smart Readiness Indicator, member of national and international standardisation groups.

Dr.-Ing. Tobias Kropp
FOUNDER AND COO

Civil engineer with a doctorate from KIT’s Chair of Facility Management. Data-based process optimisation in building operation, benchmarking in facility management, refurbishment of existing buildings and energy retrofits.

Mario Dropulić
Mario Dropulić
FOUNDER AND CTO

Business information systems graduate with more than 25 years of experience in IT consulting and software projects. Focus on AI applications, software architecture, automated document and data analysis and the digitalisation of processes.

Curiosity
We question the familiar and explore new paths.
Excellence
Data-driven, verifiable and clear in communication.
International outlook
Contributing to national and international solutions.
Resilience
Challenges are also opportunities.
Transparency
Clear structures, honest processes, decisions you can follow.
Collaboration
Team spirit, open communication, shared goals.
SUPPORTED BY
EXIST logoCyberLab logoAXEL logoGroundbreakers logo

BAIOSS

Understand. Decide. Design. Operate.

The guided self-assessment is free after registration and immediately delivers an evaluation across all domains, services and impact criteria.

Try it for free → Book a call
baioss.de